


|
|
|
|
 |
 different color for each decade |
 |
 |
 |
 |

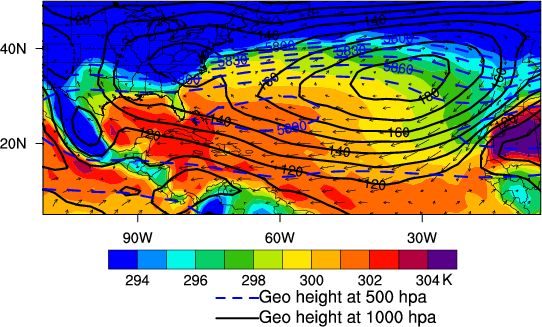
Average for ASO (August, Sept. Oct.) of 1980-2009 |

Trajactories for all the named storms since 1980 through Caribbean |

|

|

|

|

|

|

|
|

|
|

|

 Figure with 500hpa height
Average for ASO (August, Sept. Oct.) of 1980-2009 |

Trajactories for all the named storms since 1980 through Caribbean |

|

|

|

|

|

|

|
|

|
|

|

|

ENSO years since 1980 |

|

ENSO years since 1980 

|

|

|
 |
 |
| Caribbean Area | Whole World |
 |
 |
 |
 |
 |
 |
 |
 |
 |
 |
 |
 |
 |
 |


| El Niño | La Niña | ||||
| Weak | Mod | Strong | Weak | Mod | Strong |
| 1951 | 1986 | 1957 | 1950 | 1954 | 1955 |
| 1963 | 1987 | 1965 | 1956 | 1964 | 1973 |
| 1968 | 1994 | 1972 | 1962 | 1970 | 1975 |
| 1969 | 2002 | 1982 | 1967 | 1998 | 1988 |
| 1976 | 1991 | 1971 | 1999 | ||
| 1977 | 1997 | 1974 | 2007 | ||
| 2004 | 2009 | 1984 | |||
| 2006 | 1995 | ||||
| 2000 | |||||